Publishing and Disruptive technology

The second session of LAPIS was very informative, we discussed Printing/Reading/Books: From the knowledge to the sharing economy. However, I will focus on what I was most drawn to during the lecture.

What is publishing now? Years ago book publication was solely the responsibility of publishing houses. Where the manuscript goes through a process such as proof reading and editing etc. the typeset and the cover design was selected and then it was printed and distributed to the various book stores around the world. The ‘then’ process may now be thought of, as a slow one when compared to the way in which distribution/dissemination of information is now done, thanks to ‘Disruptive technology/innovation.’

The term disruptive technology was coined by Clayton Christensen to describe /explain what happens when one new form of technology displaces an established technology and shakes up the industry or a ground-breaking product that creates a completely new industry.

Hence, according to John Feathers (2006) Publishing is a commercial activity of putting books into the public domain. Publishers decide what to publish and then cause it to be produced in a commercially viable form e.g. e-books, the product is then advertized and sold through a network of wholesalers and retailers.

Further, we discussed Marshall McLuchan’s quote that is quite relevant in today’s society ‘the medium is the message’ that appeared in his book ‘Understanding Media: the Extensions of Man’ which was published in 1946. McLuchan saw the medium as having a symbiotic relationship with its audiences since it was established that the medium influences how the message is perceived.

Clearly publishing has undergone many fundamental changes over the years, and as my classmate Dominic

states, ‘the publishing sector has severely been disrupted by the emergence and growth of internet-based technologies – notable examples include the development of self-publishing as a viable business model, the development of e-readers and the replacement of traditional encyclopedias and reference sources with free, sourced alternatives such as Wikipedia.’ …

Until next week!
‘Publishing is no longer confined…’

I’m from Guyana, and everyday I usually read one of our leading newspapers just to keep track of what’s happening in my country and lo and behold I saw this letter to the editor and decided that I must share 

. flip to page 4..i’m still struggling with embedding stuff…lol.

Publishing in an ever-changing society

Libraries and Publishing in an Information Society is one of my second semester courses for MSc Library Science. The first session was more of an introduction of the course content and structure. The definition and how technology has affected the work of the traditional publisher was also explored, videos were shared to demonstrate how content and form differs. It was very interesting and it caused me to dig deeper into understanding how the technological advances would affect the print document or publishing in society. Environmentalist would be cheering if less books are printed for the sake of the tree but what about people living in countries where broadband internet is just a dream or may take another ten years before it reaches that part of the world and when it do, would the lower classes of people be able to afford the cost of broadband?…just a thought! The National Archives   gives a detail description of what publishing entails along with its processes and practices. Further, While looking for literature to expand my knowledge in the area of publishing I stumbled upon this video   which described academic publishing in the digital era in a very simplistic manner. For those of you who are thinking of throwing out those books in print format because you prefer the e-books kindly think of those less fortunate people who are longing to get their hands on a book and make a donation…please!

Data and Text Mining

What is Data and Text mining?  Data mining is a class of database applications that look for hidden patterns in a group of data that can be used to predict future behavior. Data mining uses sophisticated mathematical algorithms to segment the data and evaluate the probability of future events.  data mining helps analysts recognize significant facts, relationships, trends, patterns, exceptions and anomalies that might otherwise go unnoticed. The key properties of Data Mining are Automatic discovery of patterns, Prediction of likely outcomes, Creation of actionable information, and it Focuses on large data sets and databases. Text mining on the other hand is the analysis of data contained in natural language text. Text mining works  by transposing words and phrases in unstructured data into numerical values which can then be linked with structured data in a database and analyzed with traditional data mining techniques.

The difference between regular data mining and text mining  is that in text mining the patterns are extracted from natural language text rather than from structured databases of facts. Databases are designed for programs to process automatically; text is written for people to read. We do not have programs that can “read” text and will not have such for the forseeable future. Many researchers think it will require a full simulation of how the mind works before we can write programs that read the way people do.

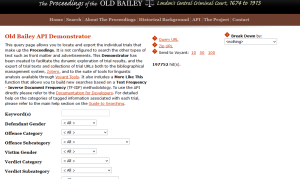
One of our tasks in DITA labs was to explore the Old Bailey Online site (the API demonstrator) and the Utrecht University Digital Humanities Lab to compare the way in which each used data mining.

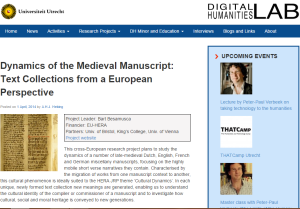
I explored the Utrecht University Digital Humanities Lab and was particularly interested in the Dynamics of the medieval manuscript: Text collection from a European Perspective. Upon observation I noted that the site just gives a synopsis of the project and there is no hyperlink to text analysis tools.  See screen shot below:

Digital Humanities Lab

Unlike Old Bailey Online site which allows the direct export of data to Voyant and you can chose the amount of search results that you would like to export ranging from 10, 50 and 100. See example below:

Old Bailey Online

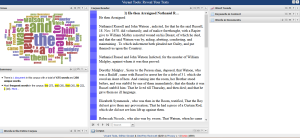
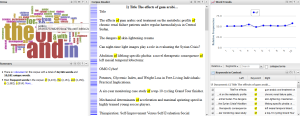
One of the data sets that were exported via voyant tools created data visualization shown below:

results

Experimenting with the text visualization tools was very interesting!

“Screwing around” with Datasets (Text Analysis)

I know that the ‘screwing around’ got you thinking, what the hell is he/she talking about right? Well contrary to your little dirty minds, ‘screwing around’ used in this context means to be browsing; you know when you not too sure of what you are really searching for, as Stephen Ramsey 2014  nicely explain.

What is text analysis? Text analysis tools break a text down into smaller units like words, sentences and passages and then gather these units into new views on the text that aide interpretation. Geoffrey Rockwell

gives a brief history of electronic texts and text analysis according to Rockwell a good way to understand text analysis is to look at the tradition of concordancing from which it evolved. A concordance is a standard study tool where one can look up a word and find references to all the passages in the target work where that word occurs. They are alphabetically-sorted lists of the vocabulary of a text (its different words or phrases). Occurrences of each word (the keyword) appear under a headword, each one surrounded by enough context to make out the meaning, and each one identified by a citation to the text that gives its location in the original.

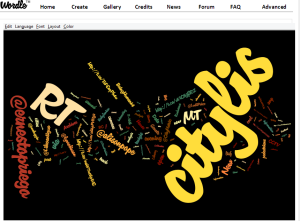
In DITA lab session #Citylis students had a wonderful experience of screwing around with Wordle, Many eyes and Voyant, these are all JavaScript tools that aids text analysis. The datasets that we were urged to save in previous lab sessions were used to experiment in Wordle etc. Wordle generates word clouds from the datasets that were created. Word clouds add flare to your text by allowing you to change fonts, layout and colour schemes. Below is an example of a text analysis produced in Wordle: (#citylis top tweeters)

capture3

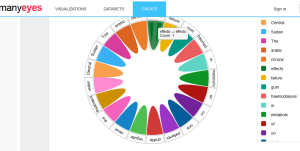
Datasets of journal articles inserted into Many Eyes for text analysis created the following:

Capture4

Datasets of journal articles inserted into Voyant produced the following:

Capture5

Interesting as it is working with these JavaScript tools, Jacob Harris view word clouds as harmful to journalism. For what its worth, I enjoyed screwing around with the text analysis tools!

Altmetrics: Alternative Metric

The Digital Technologies are really progressing at an alarming rate, hence, the need for librarians to keep up with the changes. Of late, there is much rambling about Altmetrics which seems to be replacing Bibliometrics or incorporating some of the Bibliometrics  measures into the newly coined Altmetrics,but what does this really implies? And how does it promote scholarly work? below is my interpretation of it all.

What is Altmetrics?

Altmetrics (Alternative Metrics) which was developed in the 2010 is an evolving concept, According to Jason Priem, Paul Groth & Dario Taraborelli  Altmetrics is the study and use of scholarly impact measures based on activity in online tools and environment, that is,  it is used as an alternative measure to determine research usage and impact. Robin Chin Roemer and Rachel Borchardt states that the main distinction between Bibliometrics and Altmetrics is the type of data that is being used, with the main theory behind Altmetrics being the use of new, different types of data to determine impact and quality. Moving beyond citation-based views of scholarly influence, Altmetrics gives authors data like article page views and number of downloads, along with social media and article sharing indicators of impact that complement citation-based metrics.

How does Altmetrics work? Altmetrics maintains a relational database of online academic publishers and other information websites to record the usage level of certain articles, a ‘mashup’ of API is then created from social media networks such as Twitter, Facebook, Reddit etc, to cultivate their data output in JavaScript Object Notation (JSON) from there onwards it can be exported to Google sheets as (csv or pdf files) for data analysis.

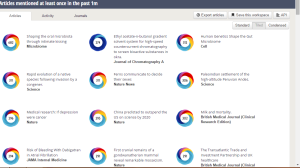
During our DITA lab session, we were tasked with the assignment of searching for and exporting Altmetric datasets using Altmetric Explorer below is an example of the data obtained. It was quite an experience working with Altmetric Explorer!

Capture2

How does Altmetrics promote scholarly research /workErnesto Priego 2013  suggests strategies to get your research mentioned online and supports Dr. Terras from University College London who posits, ‘If you tell people about your research, they will look at it. Your research will get looked at more than papers which are not promoted via Social Media’. Hence, it is widely believed that Altmetrics help in promoting scholarly work. Further, Khodiyar et al. 2014 noted that Altmetrics can recognize that the “peer-reviewed article is no longer the sole measure by which a researcher’s productivity can be assessed” For example, Altmetrics can measure comments so that “researchers could be evaluated both in terms of the individual’s contribution to post-publication discussions of others’ work, as well as by evaluations of the researcher’s own work by their peers”.

Open Data , Data Visualization and Analysis: Making sense of it!

Open data is information that is released by organizations to the public in datasets, data sets, if you can recall is a collection of factual information in electronic form. This allows for and support the Freedom of Information (FOI) and it increases transparency, as A. Rae 2004, posits, ‘open data has increased transparency, improved access to information and helped places begin to understand and solve problems.’ However, this data should be presented in such a way that anyone can interpret what is being presented.

What is Data Visualization? Data visualization is a general term that describes any effect to help people understand the significance of data by placing it in a visual context, in short, it is visual representation of data that goes beyond the standard charts and graphs commonly used in Excel spreadsheets, today’s data visualization tools displays data in a more enhanced and sophisticated way such as heat maps, bar, pie and fever charts among others.

This was illustrated in one of our DITA sessions where TAGS were created for #citylis top twitters and data visualization of the results were presented. The data revealed here was very amazing!

Data analysis is the process of discovering and understanding the meaning of data that is presented to us, it is making sense of the information, hence, data visualization is a core and usually essential means to perform data analysis in an effective way.

Web services and API’s !!!

Thanks to API’s and web services we can now embed a video or anything that we wish to see displayed on our web page. But what exactly is API and how does it work for us? what is web service? below is my understanding on the API and web services.

Application Programming Interface (API) allows access to systems’ functionality without involving the consumer/user, the API allows a software to communicate with a remote application over the internet through a series of ‘call’. ( in short it allows other application to communicate with it) The call back between applications are managed by web services. Web service is a way of transferring information over the internet using Extensible Markup Language (XML) which is primarily aimed to be read by machines only. It should be noted that XML describe the content of a document while HTML provides instructions about the structure of a document.

One common example of API at work is the simple process of cut and paste from one Microsoft document to another.API’s are crafted to expose chosen functionality and/ or data while at the same time safeguarding other parts of the application which provides for the interface.

API’s along with JavaScript allow us to embed video, maps etc into the web page, for example Google map as shown below:

Isn’t the world of Technology amazing!!

Information Retrieval & Databases

I’m now beginning to get a hang of signing into wordpress and sharing what i’ve leaned, however limited this may appear to the readers…lol…this is purely work in progress…thanks to Ernesto..

Here is a very simplistic explanation of Information retrieval and databases is given, drawing from the readings of Bawden & Robinson (2012) and my classroom learning.

Information retrieval may be interpreted as the way in which information resources are obtained and are relevant to your information needs from a collection of stored data. The data may be either Unstructured or Semi-Structured data. Unstructured data usually refers to information that is not presented in a row-column database, examples of unstructured data includes text and multi-media content i.e, photos, email messages, videos etc. Whereas Semi-Structured data is a combination of structured and unstructured data and tags are used to identify certain elements within the data, there is no rigid structure.

I cannot write about information retrieval without making mention of data retrieval, Data retrieval is a means of obtaining  data from a Relational Database Management System (RDBMS), here, data is presented in a structured way and usually requires  Structured Query Language (SQL). Important to note that with RDBMS there is no repetition or duplication of  information.

Information Architecture

So i’m sitting in front of the PC, starting at the blank screen, thinking…come on Clyden, you have to type something that makes sense!. Moments like these (if you ever find yourself in a similar position) don’t dare glance over at your neighbour who is pounding away at his/her keyboard making writing a “Blog” appear so easy,  if not you would end up wishing you were in the wrong class. Yes, so now that i have made my anxiety about writing a blog page and posts clear, i would now attempt to share my first exposure to the world of  Digital Information Technologies & Architecture.

What exactly is Information Architecture? Well from my understanding IA cannot be summed up in a single phrase, however for this page i will define as follows and please feel free to correct or add to this because as i indicated this is my simple interpretation…here goes: IA have to do with the creation of a structure that organizes information, hence, making it accessible to users in what appears to be a user’s friendly environment, and of course before i got to that understanding i was asking myself..Isn’t that what the Web developer does? Yes! i was that naive. However, now i can be proudly inform you that the role of a web developer is different because the web developer builds the website using specific languages such as Javascript, XML, HTML etc, while on the other hand, IA deals with what goes where, that is, keeping information carefully organised and labeled, thus making navigation on a web site easy.

The first session made me recognized the difference between the internet and the World Wide Web (www), a web page and a web site, and further enhanced by knowledge base by learning about databases, document structures, character encoding, bytes and bits and of course, blogging!!…until next time..chao.